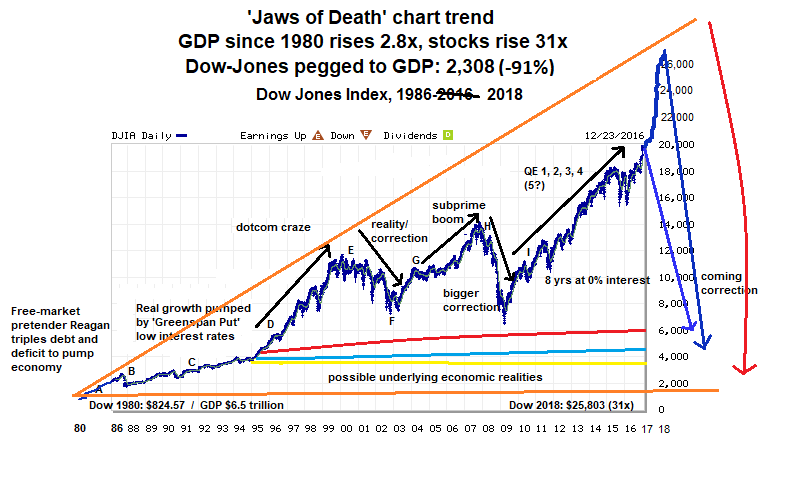
(Update 10/24/2017: Please note that I described this crash as ‘imminent’ in long-term financial cyclical terms, i.e. sometime in the next 5-10 years; none of us know the length of time that central banks can forestall a correction. Considerable gains (~19%) have occurred since this was written, but remember that 401k holdings and other kinds of publicly traded securities are not money or property, they are just numbers on a page, poker chips in the stock market casino. Will you know when to cash them out for something real? Recall also that selling to hold largely cash was never advised. Update 1/14/2018: new chart added demonstrating stock crash of 91% is now needed just to return to price-proportionality with GDP, real estate, and CPI since 1980. To vindicate my mode of analysis and chosen timeframe, consider some past Dow boom-time highs, adjusted for inflation: January 1966 (7,624; -71%), September 1987 (5,738, -79%), September 1929 (4,894; -82%). Those are the three pre-Greenspan peaks in US history. The non-boom years routinely approach or exceed 90% below today adjusted for inflation (an extreme example: November 1920 (946 adjusted: -96.4%). If you think we’re now 4-5x hotter than those three boom peaks, I have a bridge I need to sell for cash fast. A correction of the above magnitude would wipe out decades, let alone years more of hot stock gains, but if you’re on the CNBC Kool-Aid and utterly certain the Fed’s low-interest snake-charming will never, ever stop, dance on.
Note: New charts have been added
Anyone familiar with online ‘content’ in the conspiracy realm knows that it is almost always accompanied by a specific economic prognostication characterized by pessimism around the US dollar and US economy’s immediate future and relative optimism around assets not intricately tied to them. Conspiracy commentators (though I prefer the term critical, not conspiracy), myself included, say we are living in a false economic reality of a grotesquely overvalued stock market and currency (and therefore government debt), the mother of all financial bubbles, and when the bubble pops there will be great consequences.
Many including me believe this bubble and the ‘big, fat, ugly bubble’ referred to by Donald Trump in a campaign speech last summer, a bubble that was certainly not first detected by Trump and has been talked about frequently and at length by a host of economic and political commentators, such as Peter Schiff, Marc Faber, and Ron Paul for at least the last 10 years, are one and the same. Again, this isn’t to cast Trump as any kind of prophet, only to point out that our next President was aware and fearful enough of its threat to make reference to it and the possibility of a related ‘massive recession’ in a handful of speeches. He mostly kept a lid on the subject though, since the telling of unpleasant truths is not typical campaign trail fare (actually, it’s unheard of) and would have put the kibosh on his candidacy instantly. (Bringing up Trump’s comment also provided for a handy article title.)
While I disagree with the projected ‘zombie-apocalyptic’ consequences of a crash that is warned of by many ‘alternative’ media channels (where guns, storeable food, and outdoor gear become key to survival; though I do think these things are absolutely worth obtaining in case of other kinds of disaster scenarios) there is a wealth of evidence that the oft mentioned ‘big crash’ will indeed occur, likely very soon, and possibly be brought about intentionally via Federal Reserve interest rate hikes. The argument that will be made below is that we are facing an imminent and massive stock market correction that will dwarf that of 2008, 1987, and 1929, and in fact any other market crash over the last 500 years in terms of the amount of wealth lost.
This still doesn’t mean an apocalypse, but it will mean big changes and the instant shattering of long-held misconceptions about investing and economics that have been harbored even by Americans in their 60s and 70s for their entire adult lifetimes (that blue-chip stocks don’t lose money, that passive investments will always generate 10%-plus returns, that passive stockholding where the money is not truly committed deserves any considerable return at all, that a primary residence (i.e. non-rental or -business property) is an appreciating asset and not a (however slowly) depreciating durable consumer good, that purchasing government debt in countries with fiat currencies is a secure investment; among many others). Above I described the crash as imminent; by this I mean likely to fully play out anytime in the next 5 to 10 years (perhaps in the next couple months).
The argument for this will be presented primarily via two charts. The first will show the past few decades of stock index prices, and the second will show the creation of money over that period. A clear picture emerges: stock prices are determined by money creation, not economic prosperity, something that is hardly news to many of us, but unthinkable to the perma-bulls in mainstream financial TV networks and newspapers. A US economy that has quadrupled on paper since the late 1990s has actually been in decline since then (and has a vastly weaker balance sheet than it did in the 1950s and 1960s).
The bursting of the Dot Com bubble in 2000 was supposed to lead to a large correction, a necessary step to temper all booms, bringing the Dow Jones Index – which in simple terms is the combined stock price of a broad sampling of 30 large US corporations – down to 5,000 or lower. Instead, the Federal Reserve, apparently for purposes of political expediency has intervened with increasingly large rounds of quantitative easing or ‘QE’ and has artificially pumped the Dow to 20,000. Meanwhile manufacturing, real wages, and productivity have sagged and debt has soared. The past five years show that QE appears to be no longer working, which means the long-overdue crash may occur sooner rather than later.
This chart shows the last 30 years of the Dow Jones Index. A 30-year period was chosen because it encompasses most or all of the lifespan of many readers, and because it describes most of the new era of the US economy, one characterized by the outsourcing of manufacturing, the frenzied ratcheting up of debt and money to prevent necessary recession, and the stagnation of wages. The ‘old’ US economic era was characterized by sound money (before 1971), low debt levels, high wages, and a strong manufacturing base. The early-1970s to mid-1980s can be understood as a transition between these two eras. Keep in mind that the 30 stocks that make up the Dow Jones Index are the bluest of the ‘blue chip’ stocks, which supposedly do not undergo dramatic price changes.
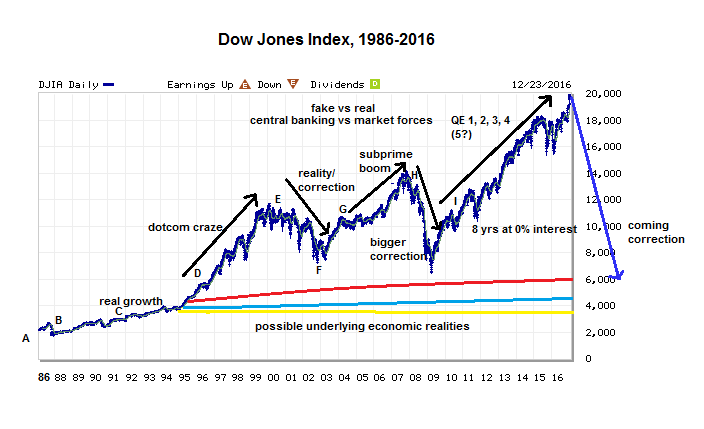
The narrative of the chart is as follows:
A) Following 1970s recession and deindustrialization, the hangover from the misguided spending policies of Lyndon Johnson, the national debt triples under false free-marketeer Ronald Reagan, resulting in an artificial boom through the early-to-mid 1980s.
B) The 1987 stock market crash aka Black Monday occurs, resulting in a 22% loss to the Dow.
C) The ‘Greenspan Put’ low interest-rate policy, which newly installed Fed chair Alan Greenspan would keep in place 2001, is initiated immediately afterwards, short-circuiting the crash. By 1991, the cheap-debt-fueled market recovers to pre-crash levels.
D) The Dot Com boom begins to rev up, quickly becoming a full-blown mania. The Dow doubles from 1993 to mid-1996, and again from 1997 to 2000.
E) The bubble pops in 2000, initiating what should have been a correction to pre-mania levels, around 4,000.
F) From a bubble peak of nearly 12,000, the Dow begins to slowly recede in 2000. The recession is accelerated by 9/11/2001, which brings the Dow to a trough of 7,000 by early 2003, a drop of 42%.
G) The Federal Reserve and federal government intercede to stave off the deepening of the recession, kicking off the housing boom aka subprime lending boom, which lasts from 2003 to 2007. The introduction of new money into the system inflates the Dow from 7,000 to 14,000.
H) In late 2007 the ‘Crash of 2008’ occurs, bringing the Dow from 14,000 to a trough of 6,600 by 2009, a 53% decline.
I) TARP and quantitative easing, billed first as ‘QE’, and then as ‘QE2, ‘QE3,’ and ‘QE4,’ are initiated, resulting in a doubling of the money supply from 2007 to 2016, and more than doubling of the national debt in that time, from $9 trillion in 2007 to $20 trillion today. The debt had also previously nearly doubled from $5 trillion in 2000 to $9 trillion in 2007. Since that time interest rates remain at or near zero.
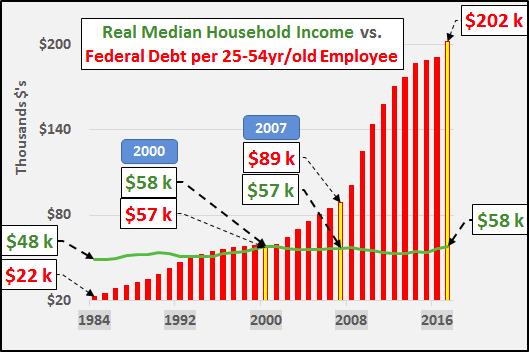
To put this into perspective, the debt increased from $900 billion to $5 trillion from 1980 to 2000, and from $300 billion to $900 billion from 1971 to 1980. , the debt rose from $200 billion in 1944 to $300 billion in 1971. The debt in the 1920s and 1930s varied from $15 to $35 billion. Upon the institution of the Federal Reserve in 1913 and US entry into World War I in 1919, debt rose from $2.8 billion in 1912 to $15 billion in 1919. To repeat, debt has increased 7,000x (not percent) since the establishment of the Federal Reserve, from $2.8 billion to $20 trillion ($19.98T). In 1910 wages generally ranged from 22 cents per hour for unskilled workers to $1 to $2.50 per hour for highly skilled workers and professionals. The average home price was around $5,000. The national debt has thus risen 200x more than has the inflation of wages and home prices. Over the last 30 years, federal debt has risen from 45% of (working) household income to 348%, which would stand at over 2,200% were unfunded liabilities ($127 trillion) to be considered:
Another version of the first chart shows the meteoric rise of stocks relative to that of the US national GDP, Consumer Price Index (CPI), House Price Index (USSTHPI), and median household income (all based on nominal i.e. non-inflation-adjusted figures). It demonstrates that a 70-80% loss is required to keep stock prices in line with other basic economic indicators.
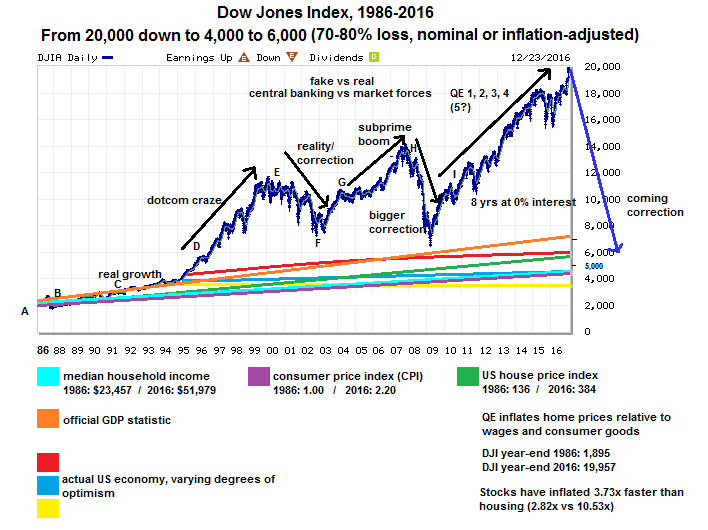
Since the bursting of the Dot Com boom in 2000, the government quadruples national debt and more than quadruples the money supply by its broadest definition, all in order to maintain the semblance of modest growth. Even by the most conservative official money supply measures, the amount has more than tripled since 2000 and gone up 9-fold in the last 30 years. Over the same period, manufacturing declines and wages barely rise. 
Beginning with that of the debt-fueled Reagan years, the corrections of artificial economic booms become more severe, from 22% in 1987 to 42% in 2003 to 53% in 2009. The only logical conclusion that can be reached is that we are facing a market correction that will be at least 60% and could approach 80% based on the scale of the central bank intervention preceding it. Assuming 2% average growth since 1994, just before the Dot Com bubble took off in earnest, the Dow should stand at 6,400 today, 68% below its current level. (The reality though, by a host of indicators, is that the economy has actually weakened or remained mostly flat since then.)
As an acquaintance of mine once posted in a succinct economic forecast based on this trend: ‘401k bout to get beasted.’
When Will This Happen? How Will This Actually Look?
Unemployment may rise and real wages will fall via inflation and the devaluation of currency, which could spur reinvestment in manufacturing. People with ‘core’ jobs in the public and private sector will likely remain employed, others who have more peripheral, less essential administrative positions or who are in the finance sector may be out of work. Many baby boomers with once rich, now ‘beasted’ stock portfolios, who have ridden a wave of asset inflation for 40 years, will have to liquidate debt-financed property like second homes, trim budgets, or even move in with their children, depending on their exposure. Gen X-ers may have to delay and reconsider the reality of their retirement. Most people will vacation and eat out less, and share the use of vehicles and other expensive items. In other words, for a few years, maybe even a decade or two, we might see a modern, more high-tech version of life in the 1940s or earlier in terms of material prosperity. I’ve seen elements of the past in countries like Ukraine and Moldova. That isn’t to say these places don’t have modern technology, but in many ways they’re living the simpler, more frugal lives our grandparents and great grandparents did. It’s a harder life, but it’s certainly not any kind of hellscape there. Until the economy undergoes deep structural reform, including of our monetary system, the belt-tightening will be severe, either by crushing deflation or runaway inflation.
I’m not claiming the US will become like the above countries with median household incomes of $2000 or $3000 per year, down from $51,000 currently. Assuming the above inflationary route is ultimately taken, I am suggesting the US median household income might be for some time be in the neighborhood of $20,000 in 2016 dollars (even if it remains at today’s levels in nominal terms), which for frame of reference is 60% higher than that of Mexico and 60% below that of today’s America. This would mean a massive reduction in GDP per capita, it would still leave the US with a $7 trillion (PPP) economy, second in the world behind China. The richest in our society will still be fabulously rich, and a sizeable minority of the population (enough to maintain a semblance of normalcy in large city centers, affluent towns, and other hubs of economic activity) would still have incomes high enough to enjoy the luxuries and conveniences most of the country now enjoys. Americans should be aware that the stated goal of the One World globalists at the highest level of the power structure is for the median income of all nations to be about $12,000 to $15,000 per year, high enough to keep citizens from revolting, low enough to keep them from amassing any economic and political sovereignty in the face of a powerful global government.
The median income of US citizens is intimately linked to discussion of the inflated stock market because both rely on the perpetuation of irrational behavior, of there being enough confidence in the Federal Reserve and US government to both demand far more value for the US dollar than the economic fundamentals of the US economy warrant, and to drive investors into US stocks and bonds above all other assets. The tumbling down of the house of cards that is the US stock and bond markets will almost certainly be accompanied by inflation. Otherwise the US government must officially default and cease or severely curtail transfer payments, causing civil unrest; unemployment and foreclosure would skyrocket, and our economic engine would seize. If inflation does come, and I believe it in all likelihood will, since the government appears to prefer sleight of hand and deception to plain truths, the purchasing power of US currency could gradually or suddenly drop by 60% or more. In one possible scenario, the Fed will continue easing but inflation will shift from assets to essentials as the market recognizes the stock bubble and divests from US stocks and Treasuries. The prices of wages and assets like stocks would remain the same in number, while the prices of commodities, especially of imports, and foreign currencies would skyrocket as new money avoided stock and bond investment. This would be equivalent to a stock price and income drop of 60% or more, though it would be hidden by inflation. All the numbers may stay the same while wealth in real terms i.e. purchasing power plummets. An inflationary scenario would allow the US to (nominally) service its debt. Or the reckoning of prices with reality could come as deflation where the value of both stocks and incomes drops out in the open and currency value remains stable, though this would require official bankruptcy of the US government. To the unobservant person, the inflation-hidden crash may never have occurred, but the damage to Americans’ pocketbooks will be the same nonetheless.
As far as timing, no one knows. It could be tomorrow, it could be in 20 years. We don’t know the power of central banks to distort and forestall economic realities, we don’t know what events the future holds. We don’t know how deluded crowds can become with respect to markets and investing.
Alternative Scenarios
Certainly there are conceivable events where all bets would be off. But barring a truly global, highly destructive war or other global catastrophe of epic and unprecedented proportions, I have zero doubt this bubble will break and anyone with index-based stock investments will lose at least 50%, perhaps 70% or more, of his or her money.
Other than some kind of mega-disaster, only an enormous boom brought about by economic strategy and political willpower we haven’t seen in America for centuries might minimize losses to 40 to 50%. It can’t prevent them altogether because the numbers themselves are figments of imagination that have become utterly decoupled from reality.
Yes, technological advances might result in bona fide growth, but A) the internet is already here, tech-company investment is itself a bubble (IT accounts for the overwhelming majority of venture capital investment), and a technological advancement greater than or comparable to the internet is probably not likely to heavily affect the market in the next five years, and B) future tech gains are not necessarily going to center around the US economy and stock market. ‘The future’ likely won’t save you in time.
As noted above, the most likely scenario is that the breaking of the bubble will happen but be obscured by inflation. Asset prices will stagnate, while prices for all goods and services, especially essentials such as food, clothing, and fuel, will skyrocket, with wages lagging behind as unemployment spikes, the supply of labor expands, leading employers to decouple salaries from inflation. Your stock portfolio’s value might be intact in terms of the number of dollars, but its purchasing power, were you to convert it back to cash, will have gone down 60% or more.
The crash may be gradual and ‘orderly,’ it may be obscured by inflation and denied or minimized by government statisticians, it may even come ‘straight’ as a swift deflationary crash, but short of one of the above scenarios, it’s going to happen.
Japan’s Nikkei Stock Index: A Case Study
If you think talk of a 30-year setback and 70% crashes is all too much, take a look at the Nikkei 225, Japan’s Dow Jones-equivalent stock index. In the 1970s and 1980s, Japan had the world’s strongest economy and biggest bull market. From 1980 to 1985, the Nikkei index rose sharply, from 6,000 to 13,000. A mania hit in 1986 and the index rose to 20,000 and 30,000 in 1987 and 1988 respectively, reaching an all-time high of 38,000 in December 1989, a 392% rise over 6 years. (By comparison, the Dow has risen 305% in the last seven years, while the GDP rose 16% over that time. Lest anyone think this problem is restricted to the Dow, the NASDAQ index has gone up 422% over the same period, and the S&P 500 has increased by 331%.) In 1990 the Nikkei began to tilt downward to 37,000 yen and then crashed, bottoming at 23,000 by January 1991 and then at 16,000 by December 1992. The crash was blamed on interest rate hikes by the Bank of Japan following a long period of loose monetary policy that fueled the boom. The index fluctuated wildly through the from the low-to-high teens for several years before bottoming again at 13,000 in 1998. By March 2003 it hit a 20-year low of 7,900. After another low-interest-rate boom it crashed again to 7,100 in 2009, a 26-year low that mirrored the US market low the same year. Today the Nikkei stands precariously at 19,000, the result of years of not just zero-interest, but negative interest rates, which are now set at -0.1% . In spite of these efforts the market still sits 50% below its all-time high of 27 years ago, and not much beyond its average year-end positions from the 1990s.
To recap, the Nikkei peaked at nearly 40,000 yen in the late 1980s and early 1990s, then crashed and averaged about 17,000 through the 1990s, and about 10,000 in the 2000s, and has now risen from 7,000 in 2009 (82% below its all-time high in 1989) to nearly 19,000 (267% in seven years) this year in another artificial boom that is on the verge of collapse, yet again resulting from misguided, expansionary monetary policy by the country’s central bank. This quarter-century and counting period of economic malaise, which will stretch beyond the 30-year mark after the next crash occurs, has been given the misnomer the ‘Lost Decade.’
For a less recent example, take our own Crash of 1929, where prices fell 85.7% from October 1929 to June 1932, and sat 72% below the 1929 high 20 years later in 1949 (adjusted for inflation).
How to Limit Your Exposure
First, don’t count on the perpetual gains and conventional investing wisdom of the last 35 to 45 years. In spite of hiccups in the form of almost-were recessions in 1987, 2003, and 2007 that were forestalled or reversed with ill-advised monetary policy, the US stock market has gone up 10-fold since 1980, while other prices have gone up about 3-fold. While you might push your luck for a few more years of gains, a correction of this magnitude could wipe out decades of 5% or 8% gains. But if you’re a stock wizard with impeccable timing, by all means, invest away. 99.9% of the population aren’t.
I’m not a financial advisor, but the solution to avoiding this kind of carnage would obviously be to move part of your wealth out of stocks and into other assets: investment in privately held companies (ideally your own), art and other commodities and collectibles, value farmland or other productive land, positive-cashflow rental property, equity in your own home: anything except major currencies (which is being devalued by quantitative easing), bonds, or publicly traded stocks. (Note added later: Sure, you may benefit from stock market gains for years into the future, but will you know when to get out? Do you want to play games with a massive correction?)
Unsurprisingly, I’m not a major stock investor. I’m writing this because I know many people with sizeable stock holdings and I don’t want them and millions of good Americans I don’t know to needlessly lose 60 or 70% of their savings that are held as stock, and because I want Americans without stock holdings to know that a major economic change is in all likelihood coming. Stocks are theoretically a great way to make money and have been a great way to make money in the US for the last century, but the US stock market of today is a fantasy world not reflective of economic reality, thanks to the existence and misguided actions of central banks. (The stock markets of some other countries may well be different, though major markets in Europe and Asia are generally not much better in terms of being subject to rigging.) Worse, the stock market is heavily manipulated on a day-to-day basis by large private banks and investment banks who use inside knowledge of future central bank policy and technology like high-frequency trading to fleece the masses before they know what hit them.
I’m not down long-term on the US and its economy. We still have more opportunity and economic potential than in most, maybe all other countries. There is advanced infrastructure and strong rule of law (not in terms of Constitutional liberties, but with regards to business contract and property law), and a can-do entrepreneurial attitude (which surely can sometimes result in unwise investment, but also is a primary factor for our outsized past growth) that is not as prevalent in many other developed nations. The country can be what it is currently pretending to be. But before then the piper must be paid (unless our government tries to burn down the world to get out of doing so), and prices, the accurate discovery of which are the bedrock of any economy, free-market and socialist alike, must realign with reality.